Key Facts
Housing Affordability in Ulster County
Affordable Housing: A commonly used definition of affordable housing is housing in which the occupant is paying no more than 30 percent of their monthly income for housing costs (rent or mortgage payment), including utilities. Households paying over 30% of monthly income are considered cost burdened.
Key Takeaways
Demographics
- Ulster County’s population is getting older. The median age in Ulster County increased from 41.2 in 2010 to 44.1 in 2020 and is expected to continue to increase over the next several years as the baby boomer generation ages. As a result, most Ulster County communities will see a need for more senior housing.
Source: U.S. Census – American Community Survey, 5-Year Estimates 2010 and 2020 (population statistics) - Hundreds of County residents are homeless. A point-in-time count from January 2020 identified 438 homeless individuals in Ulster County. 576 students in the County experienced homelessness at some point during the 2018-2019 school year. Source: Ulster County Housing Action Plan
Household Income
- Large and quickly growing employment sectors do not pay living wages. At the higher end, the Healthcare and Social Assistance sector, which as of 2021 made up 14.4% of county jobs, has an average salary of $53,202. At the lower end of wages, Accommodation and Food Services, which in 2021 accounted for 12% of jobs in Ulster County, offers an average wage of $27,796. Source: New York State Department of Labor – Quarterly Census of Employment and Wages (QCEW)
- Incomes are stagnant or declining for all but the highest earning households. The lowest earning households have seen the greatest decline in income between 2010 and 2018, with incomes down 14.3% (after adjusting for inflation). Source: U.S. Census – American Community Survey, 5-Year Estimates 2010 and 2018 (Quintile Means)
- With dropping wages and the rising cost of living, the poverty rate in Ulster County has increased between 2012 and 2020 from 12.9% to 13.7%. In some municipalities, such as the Towns of Shawangunk and Hardenburgh, over 20% of the population now lives in poverty. Source: U.S. Census – American Community Survey, 5-Year Estimates 2012 to 2020
Housing and Rent Prices
- Housing sale prices have increased 48% over the past 8 years. From 2013 to 2019, the average sale price of a single-family home in Ulster County increased by 17% and the average sale price of a 2-3 family home increased by 24%. These increases were compounded by the COVID-19 pandemic with the median home sale price increasing 31% over the past three years, from $245,000 in 2019 to $320,000 in 2021. Source: Office of Real Property Tax Services
- There is a mismatch between the housing needed and the housing being built. Most new, single-family development in Ulster County consists of larger homes with high-end finishes on large lots. As of December 2020, the average size of all homes built in Ulster County since 2015 was 2,245 square feet with a median sales price of $425,000. Source: Ulster County Housing Action Plan
- Rents are increasing while wages are stagnant. The average rent for one and two-bedroom apartments in the county have increased by approximately 40% over the past 10 years while wages have remained stagnant or declined (2010-2020). Source: Ulster County Rental Housing Survey 2020
- Housing costs are typically the largest part of a household budget. Approximately 12% of owners and 29% of renters in Ulster County spend more than half of their monthly income on housing costs, an amount that makes them considered “severely cost burdened.” Source: U.S. Department of Housing and Urban Development (HUD), “CHAS” (Comprehensive Housing Affordability Strategy) 2014-2018
Cost Burdened Households in Ulster County
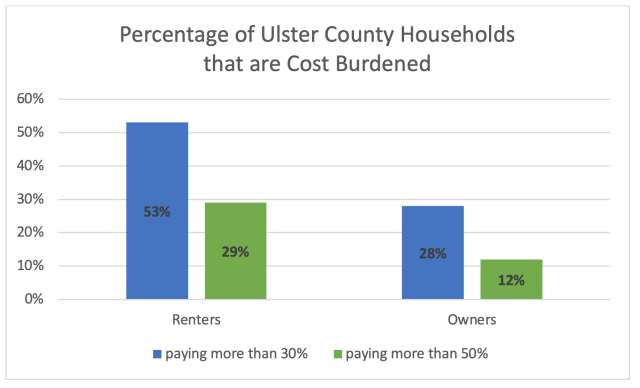
Source: HUD CHAS 2014-2018
What Housing Costs Can Ulster Households Afford?
| What Housing Costs Can Ulster Households Afford? | ||
| Annual Household Incomes | % Of Ulster County Households | Affordable Monthly Housing Costs
(30% of Monthly Household Income) |
| < $5,000 | 3% | <=$125 |
| $5,000 to $9,999 | 3% | $125-$250 |
| $10,000 to $14,999 | 5% | $250-$375 |
| $15,000 to $19,999 | 5% | $375-$500 |
| $20,000 to $24,999 | 4% | $500-$625 |
| $25,000 to $34,999 | 9% | $625-$875 |
| $35,000 to $49,999 | 11% | $875-$1,250 |
| $50,000 to $74,999 | 17% | $1,250-$1,875 |
| $75,000 to $99,999 | 13% | $1,875-$2,500 |
| $100,000 to $149,999 | 17% | $2,500-$3,750 |
| $150,000 or more | 15% | $3,750 + |
| Median Income | $63,306 | $1,583 |
Source: U.S. Census ACS 2020
Housing Costs are Out of Reach for Ulster Residents
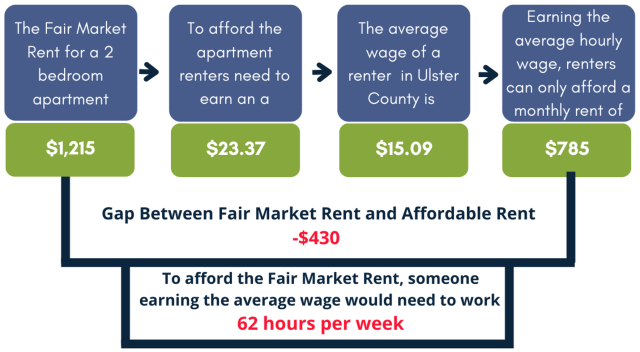
Source: ACS 2019 and HUD CHAS 2014-2018